

The S&P 500 slipped 0.5% last Wednesday after the Fed hiked interest rates for the first time in three years, but a late-week bounce left the index essentially flat for the week, down less than 0.1%.
The Fed moved its benchmark interest rate up 0.25% (25 basis points) to a target range of 3.75%–4.00%. The hike was widely expected, as markets had priced in better than 90% odds of a 25-basis point move. What came as more of a surprise is that all 12 voting members voted for the hike, making the official vote 12-0. We expected something closer to 9-3 or 8-4, but the committee was unified in its decision. Remember, at the July meeting three members voted for a hike even as the Fed left rates unchanged, which Fed Chair Kevin Warsh described as a “good family fight.”
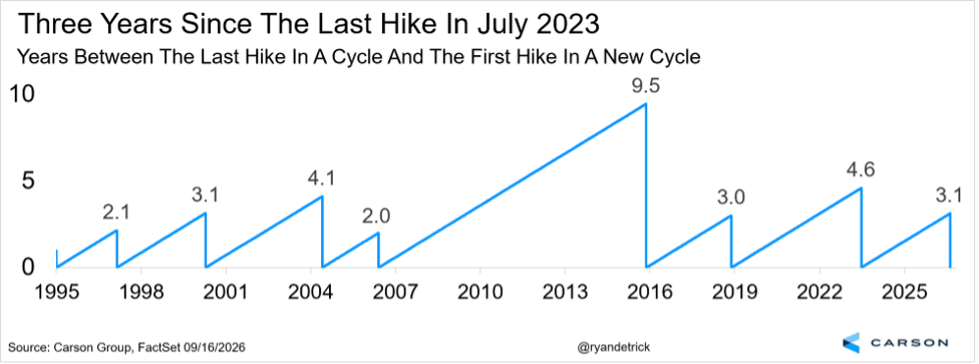
Outside of the post-Great Financial Crisis world, three years between rate hikes has historically been pretty normal.
A Hawkish Hike?
In his statement, Warsh noted that “inflation remained elevated” and that the Fed is trying to bring inflation back to the Committee’s 2% target, a level it hasn’t seen in more than five years.
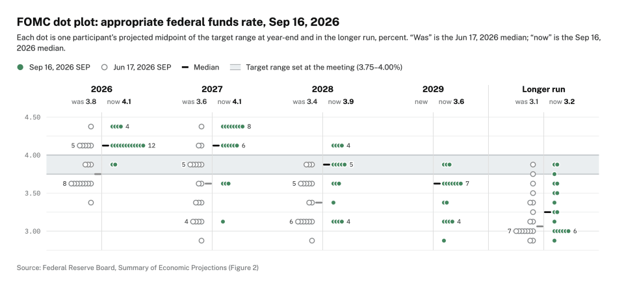
The initial market and many talking heads took this as a hawkish hike, meaning more hikes would come. That was somewhat true, as the Summary of Economic Projections—aka the dot plot (a view of members’ expectations for future policy)—showed many members now looking for another hike this year, which wasn’t the case when the last projections came out in June.
Breaking it down, 16 of the 18 members who submitted projections (Warsh once again didn’t give any forecasts) now expect another hike this year, with four expecting two. Interestingly, the median projection doesn’t call for any hikes next year, and a cut is still expected in 2028.
The bottom line is that the monetary policy path moved up only slightly, with the median dot showing just one more hike this year and none in 2027. Was this really so hawkish? We don’t think so, but we’ll get to that soon enough.
Never Short a Dull Market
There’s an old saying on Wall Street to never short a dull market. To short means you sell first, then buy back later at a lower price and pocket the difference. In plain English, a short is a bearish bet that prices will fall. The S&P 500 has been unusually quiet over the past few weeks, while holding above support from the early June peak and above its now upward-sloping 10- and 20-week moving averages.
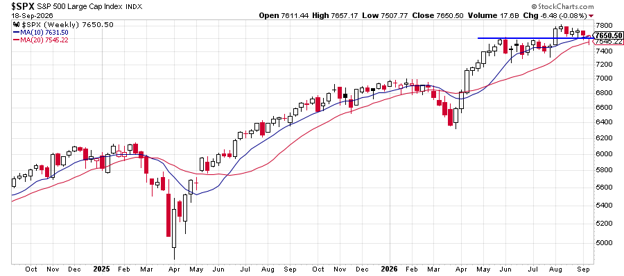
Four weeks in a row, the S&P 500 hasn’t gained or lost 1% for the week, the longest such streak in seven months. We’ve also heard all month how bad September has historically been, yet not a single day this month has seen the S&P 500 drop more than 1%, just like last September. All in all, we think a better finish to the month is still possible.
Not All First Hikes Are the Same
OK, now back to the Fed and the first rate hike in three years.
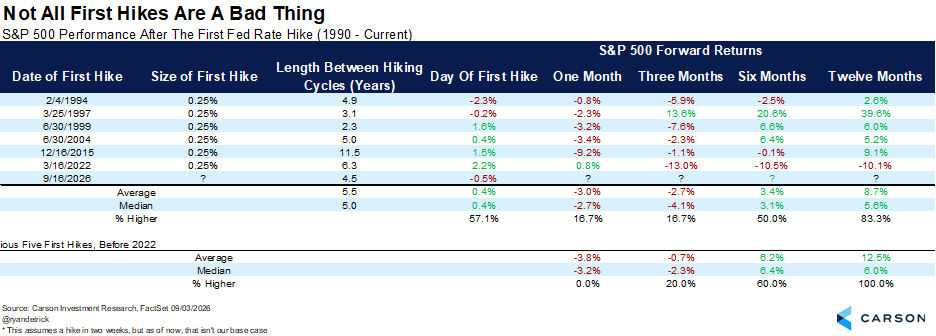
Yes, stocks didn’t do well after the first hike of the last cycle back in 2022. But back then, the Fed hiked 25 basis points, then quickly hiked 50 basis points, and then 75 basis points three meetings in a row. The Fed was extremely behind the curve on inflation (guess it wasn’t transitory after all) and had to hike quickly, which the market didn’t like one bit.
After the first hikes, stocks historically did pretty well overall, but early weakness was normal. 1997 is the clear outlier, as that was truly a “dovish hike,” with the Fed not hiking again after that first one. Still, before the 2022 cycle, stocks had been higher a year after the first hike five times in a row.
So, was the hike really hawkish? Looking closer at the dot plot, only eight of 18 members expect two more hikes through the end of next year, and not a single member is looking for more than that. We don’t see how that isn’t net dovish. Or, as our Chief Macro Strategist Sonu Varghese put it, this is a Fed that is very reluctant to hike, even with many reasons to do so.
This Is Still a Dovish Fed
The hike itself was widely expected by the time the meeting arrived. But make no mistake: We’ve come a long way from early March, when the probability of a 2026 rate hike was zero. Odds rose in mid-March, fell back to zero by April, and didn’t move above 50% until May. Even then, uncertainty lingered through late August.
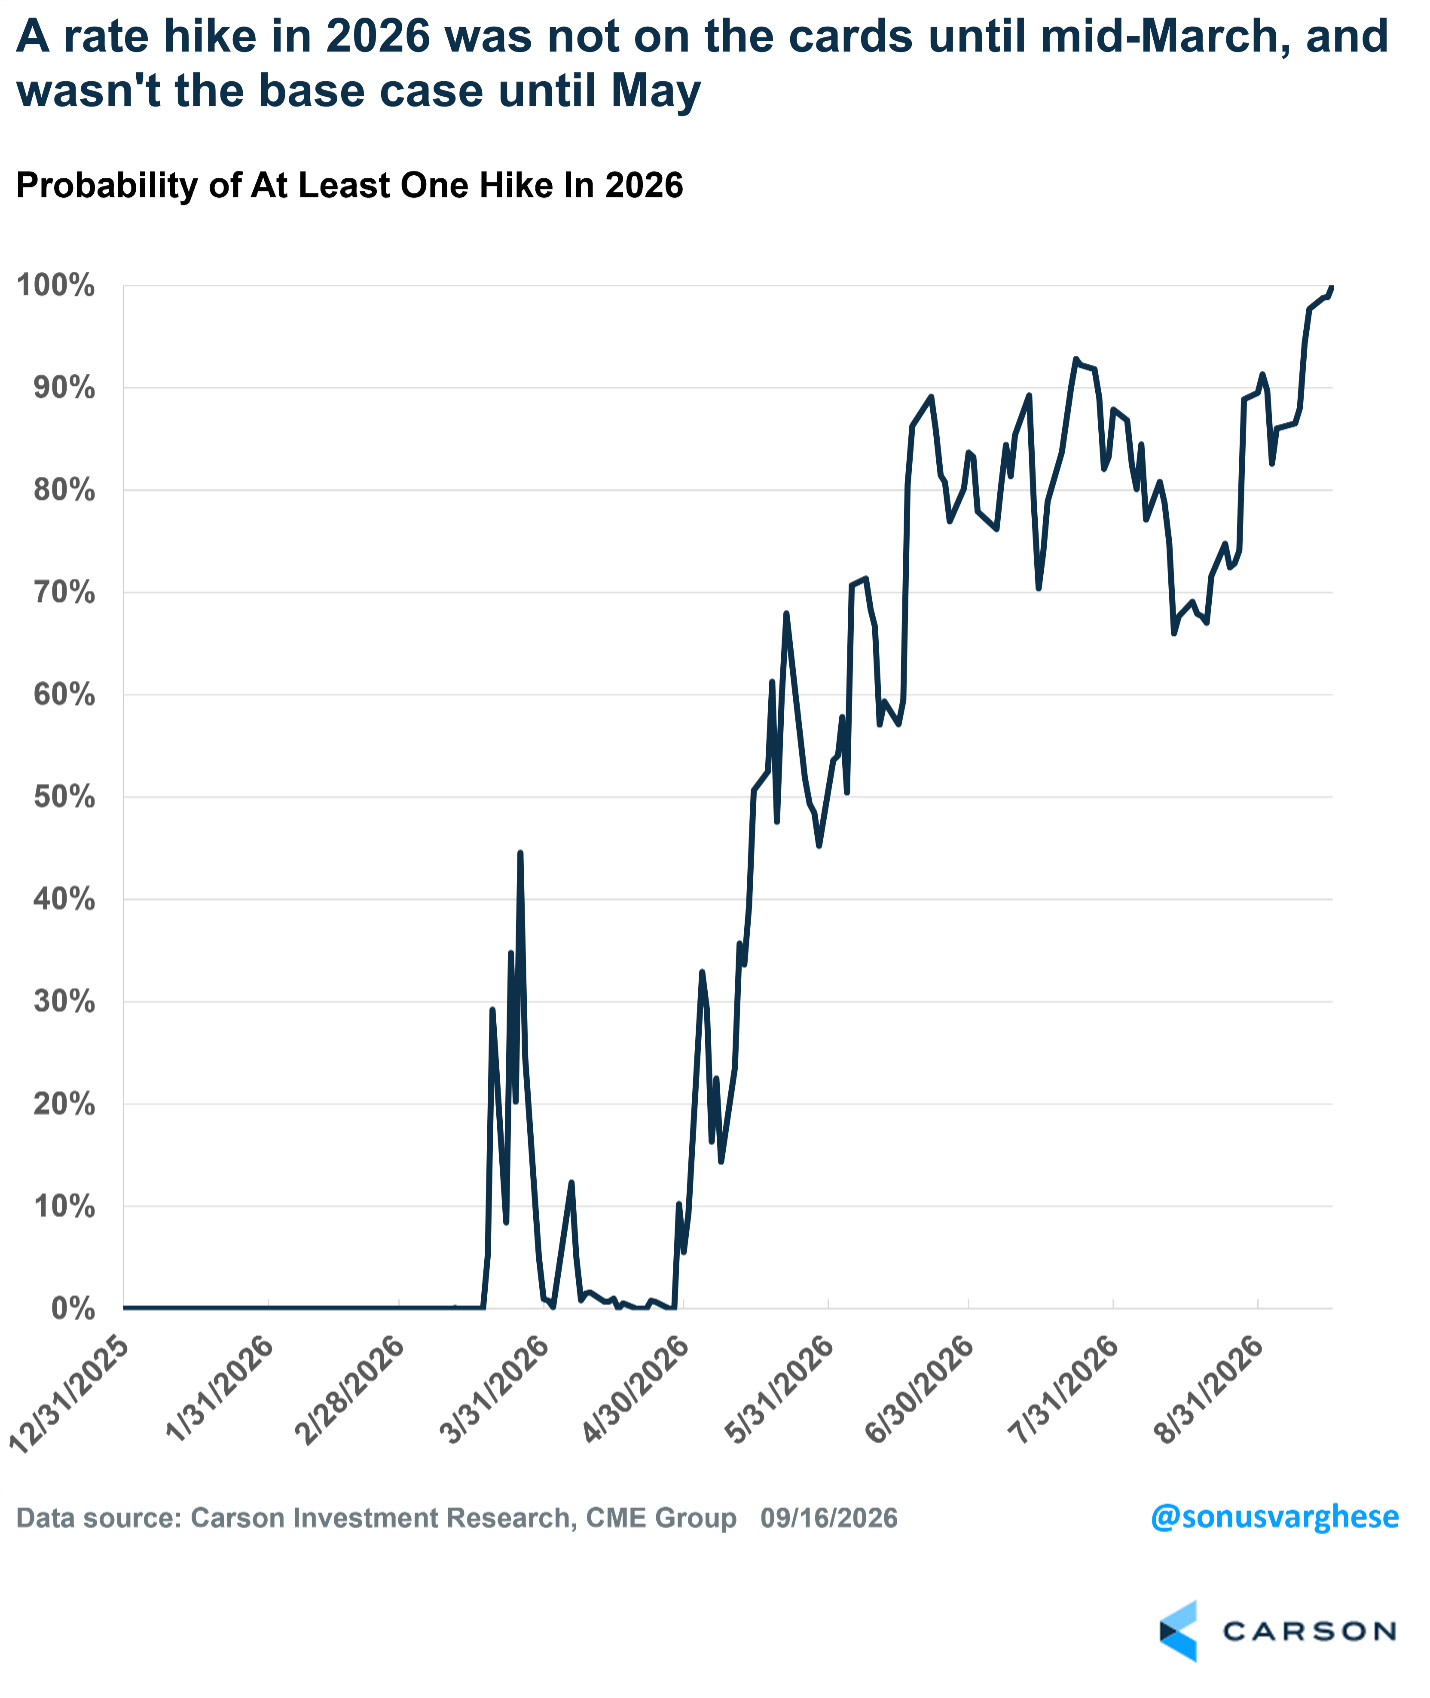
From the perspective of what was expected at the start of the year, this rate hike was a big surprise. Even a couple of weeks ago, the probability was closer to a coin toss than a near certainty.
So, What Changed?
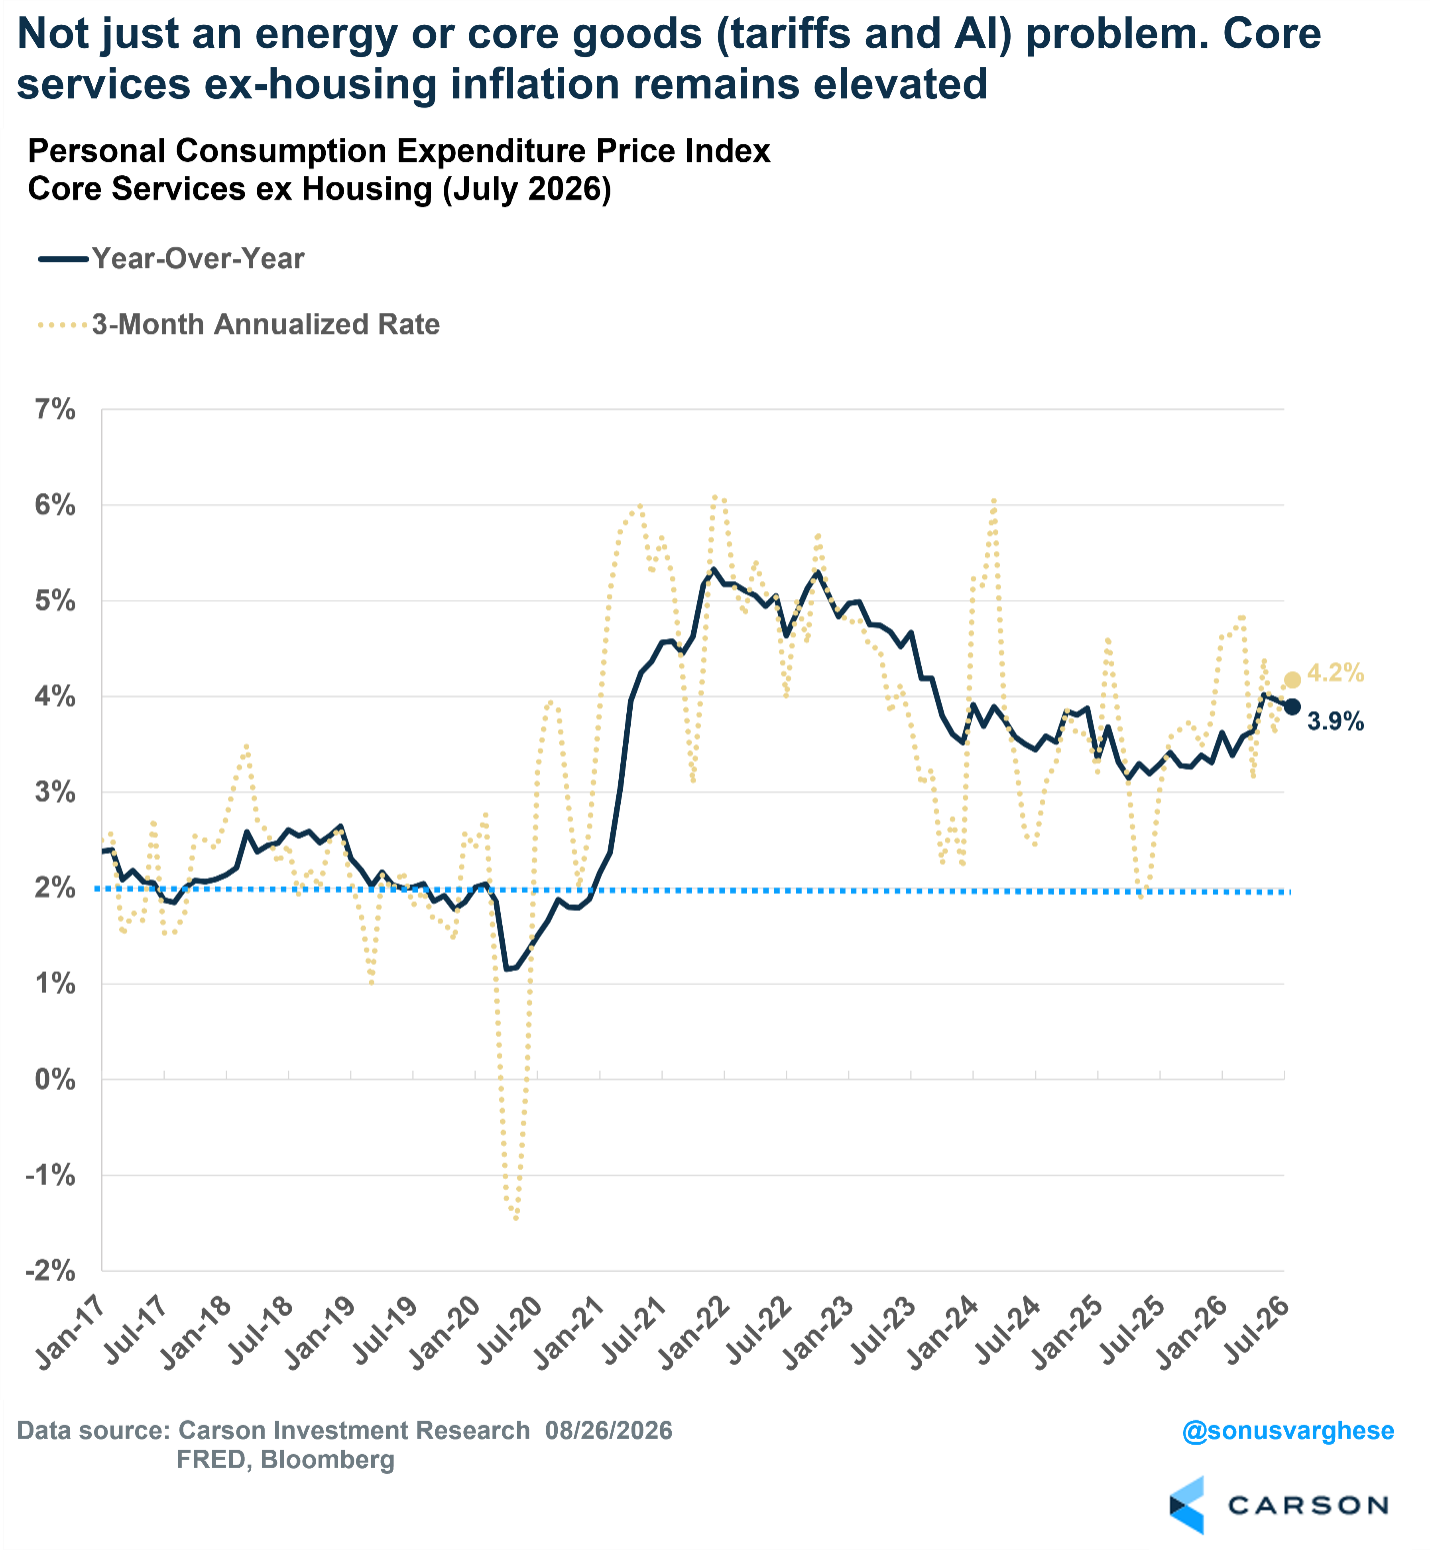
Well, obviously the inflation picture, though we were arguing all the way back in January, before the conflict with Iran, that inflation remained a problem. That’s best captured by core services PCE excluding housing, which strips out oil prices, tariffed goods, and AI-related bottlenecks. It’s up 3.9% from a year ago and has run at a 4.2% annualized pace over the past three months, well above what’s consistent with the Fed’s 2% target.
Are the Projections Really Hawkish?
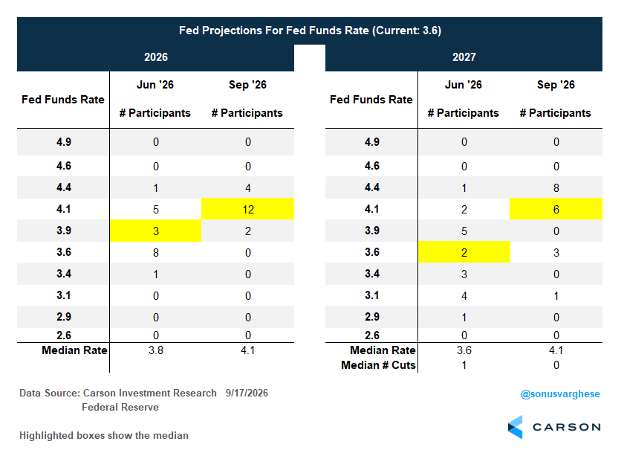
On the face of it, the updated dots leaned hawkish, even beyond the move to 3.9% (the midpoint of the new range). As noted above, the median member now projects the policy rate at 4.1% by year-end, up from 3.8% in June and implying one more hike, while four members see two more hikes this year, taking rates to 4.4%, versus just one member in June.
What’s interesting is that the median member doesn’t think more hikes are necessary beyond 2026. The median projection for 2027 is also 4.1%, implying no hikes next year, a shift from June when the 3.6% median implied a cut. Eight of 18 members do think one more hike in 2027 may be warranted, taking the policy rate to 4.4%. But not a single member sees this hiking cycle requiring more than three hikes in total (0.75 percentage points).
That’s despite stronger growth, lower unemployment, and higher inflation in the Fed’s own projections:
- The median 2026 real GDP growth expectation was revised up from 2.2% to 2.3%.
- The 2026 unemployment rate was revised down from 4.3% to 4.1%.
- Core PCE inflation for 2026 was revised up from 3.3% to 3.4%.
The core PCE expectation for 2027 was unchanged at 2.5%, but inflation is now expected to hit the Fed’s 2% target only in 2029 (it was 2028 in June). By then, inflation would have run above target for a good eight years. That’s a very, very patient Fed. In fact, Warsh said the Fed is only “removing a dose of accommodation.” That implies there’s more to remove, meaning policy remains loose while the Fed waits for inflation to pull back on its own, something even Fed officials don’t expect anytime soon.
The Longer View Looks Even More Dovish
Even more interesting is how the September projections compare with June 2025. Back then, the policy rate was 4.4%, and officials expected two more cuts, taking the 2026 rate to 3.6%. Instead, amid labor market jitters, the Fed cut 0.75 percentage points from September to December 2025. That makes June 2025 a useful baseline, before last year’s “insurance cuts.” The shift in the 2026 projections since then is striking:
- Real GDP growth has been revised up from 1.6% to 2.3%.
- The unemployment rate has been revised down from 4.5% to 4.1%.
- Headline PCE inflation has been revised up from 2.4% to 3.7%.
- Core PCE inflation has been revised up from 2.4% to 3.4%.
- Nominal GDP growth (real GDP growth plus inflation) has implicitly been revised up from 4.0% to 6.0%.
Despite these big shifts, the median 2026 policy rate projection moved up from just 3.6% to 4.1%. Another way to gauge how dovish that is: Look at the “real” policy rate, or the projected policy rate minus projected inflation. In June 2025, the implied real policy rate for 2026 was 1.2%. Now it’s just 0.4%.
Yet the median Fed official doesn’t think all of last year’s rate cuts need to be reversed; 4.1% is enough. That’s despite much hotter inflation, historically low unemployment, and nominal GDP growth running well above trend (6% versus 4% from 2010–19). Over the last 15 months, officials have also revised their “longer-run” policy rate from 3.0% to 3.2%. Think of that as their steady-state “neutral” rate, neither tight nor accommodative. Relative to neutral, policy is currently more accommodative than it was in June 2025. We don’t know how you can interpret this as anything but dovish.
Markets Expect Rates to Be Much Higher
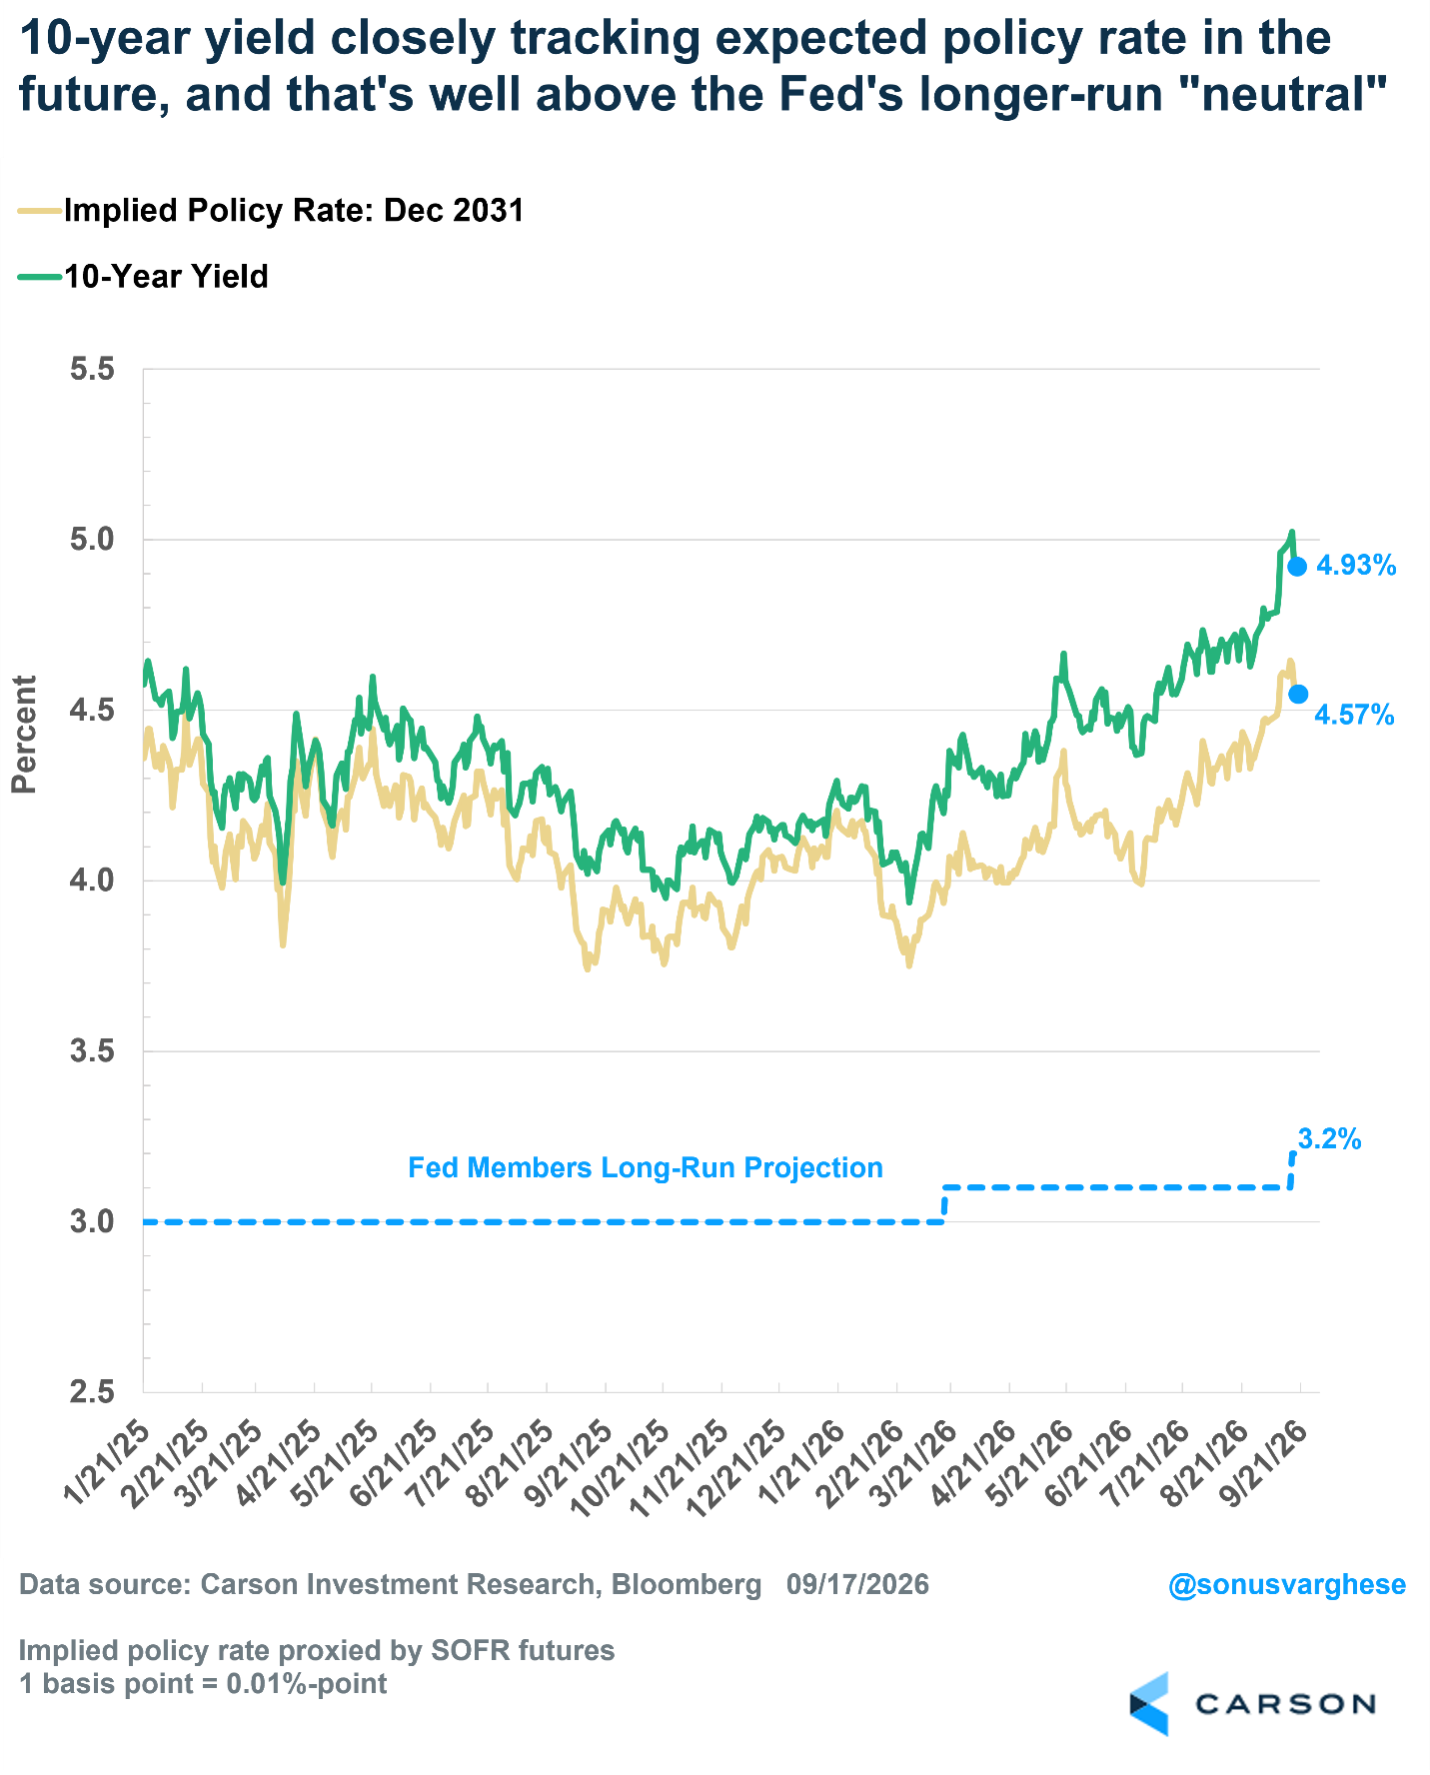
It’s one thing for the Fed to make projections, but another for markets to believe them. The entire expected policy rate curve sits above both the current 3.9% rate and the Fed’s 4.1% projection. What’s incredible is that at the start of the year, markets expected a policy rate near 3% (at least two cuts) by the end of this year, versus 4.3% now (one to two more hikes this year), followed by more hikes in 2027 to above 4.6%.
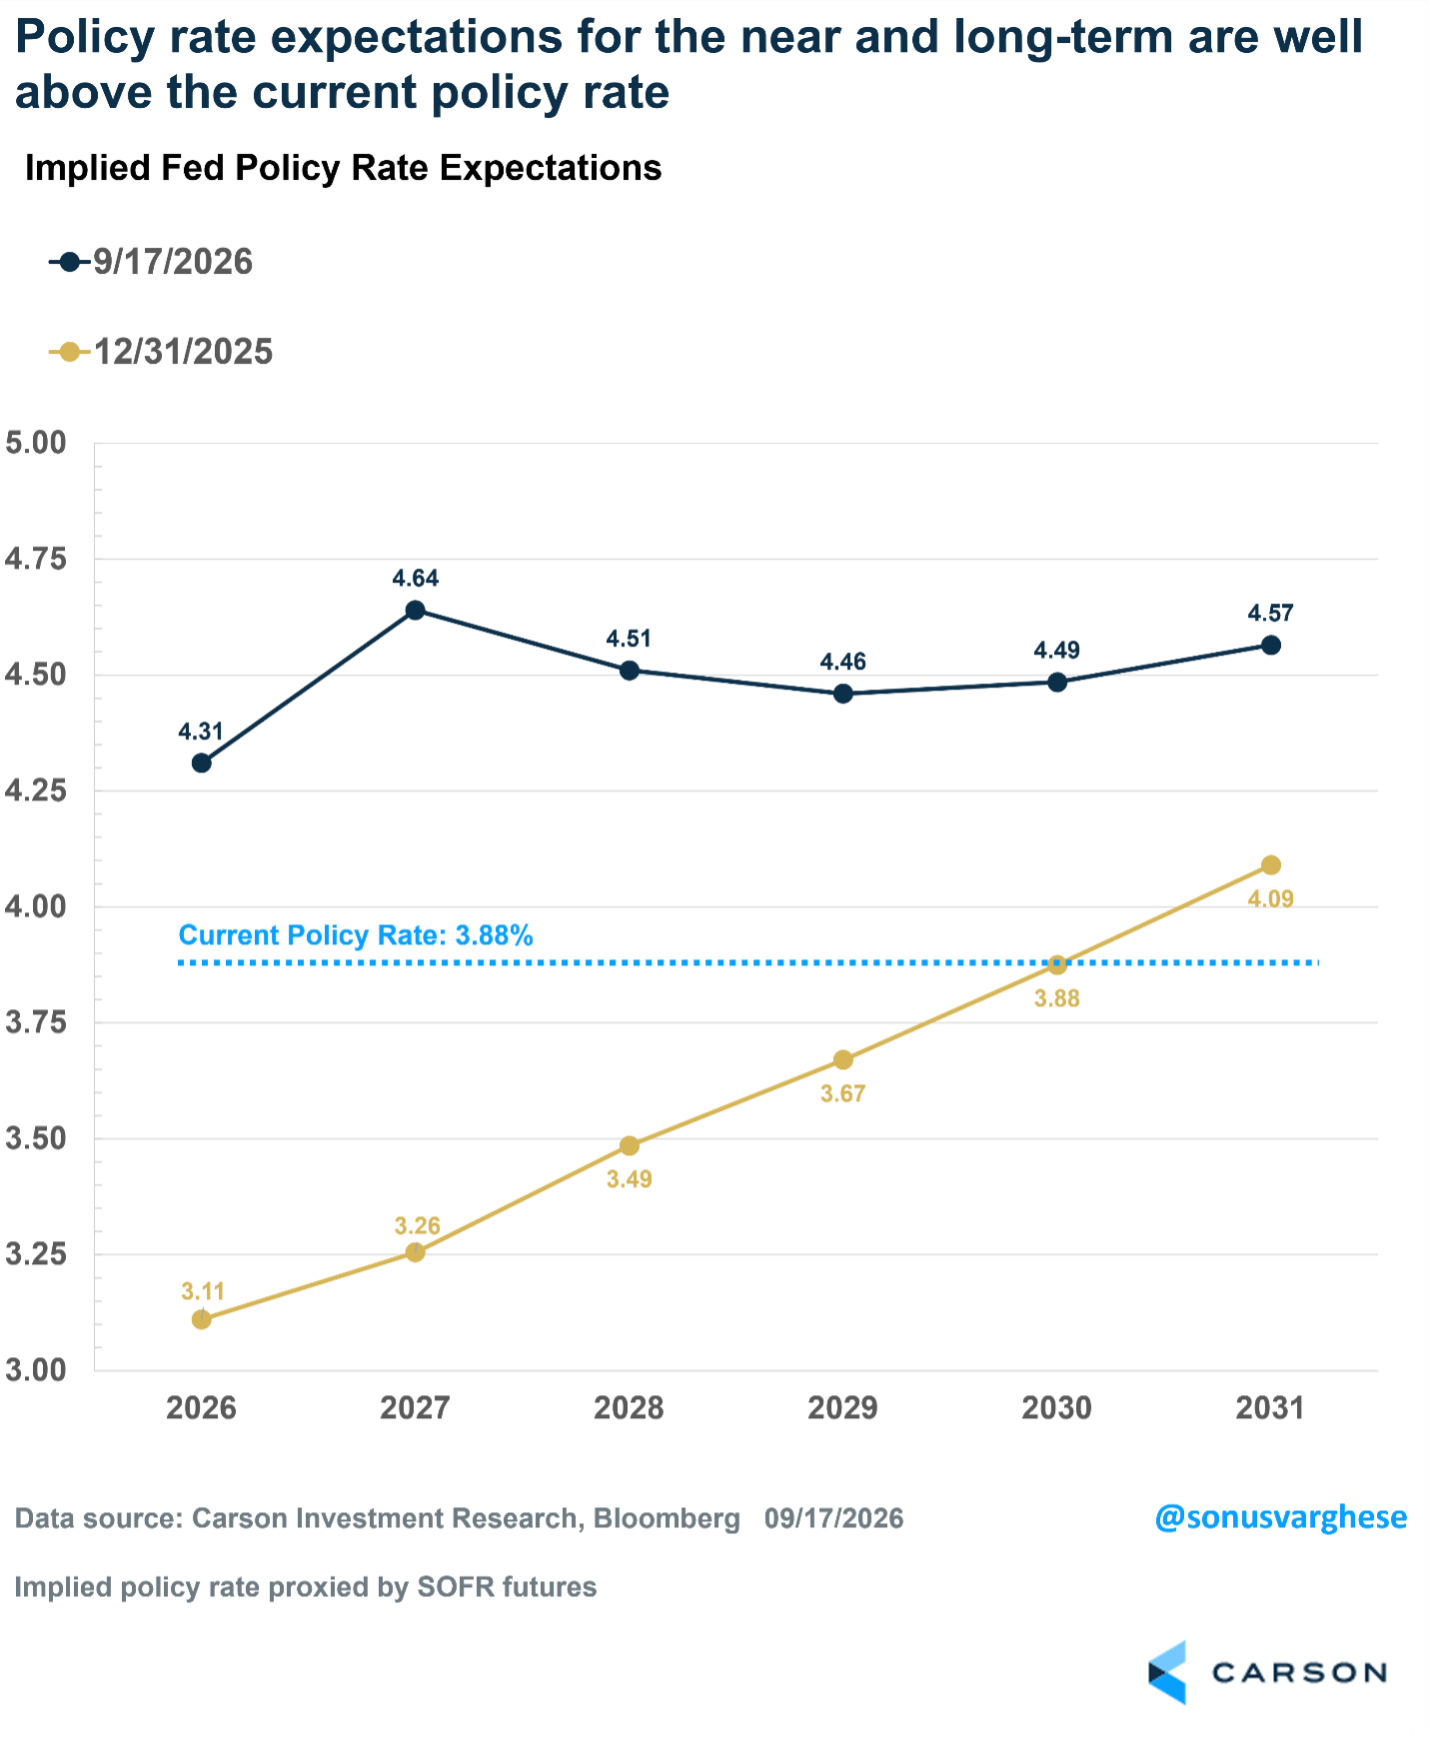
Look further out, and the disconnect is just as large. Fed officials put the longer-run rate at 3.2%. Using the expected policy rate for 2031 as a proxy for the “long run,” markets are at 4.57%. The 10-year Treasury yield, now near 5%, has closely tracked that expectation. In other words, markets expect more hikes than officials project, and rates to stay higher for longer to tamp down inflation.
Rates May Not Be High Enough for an AI-Capex Economy
In the near term, we believe a dovish Fed facing a hot economy and persistently elevated inflation is bullish for stocks. We were looking for any hint from Warsh that the Fed is worried about the AI boom and its potential to keep things hotter than it would like. There was nothing on that front, which suggests the wave may get bigger. Nominal GDP growth is running at about the same pace as in the late 1990s (~6%), but interest rates are much lower.
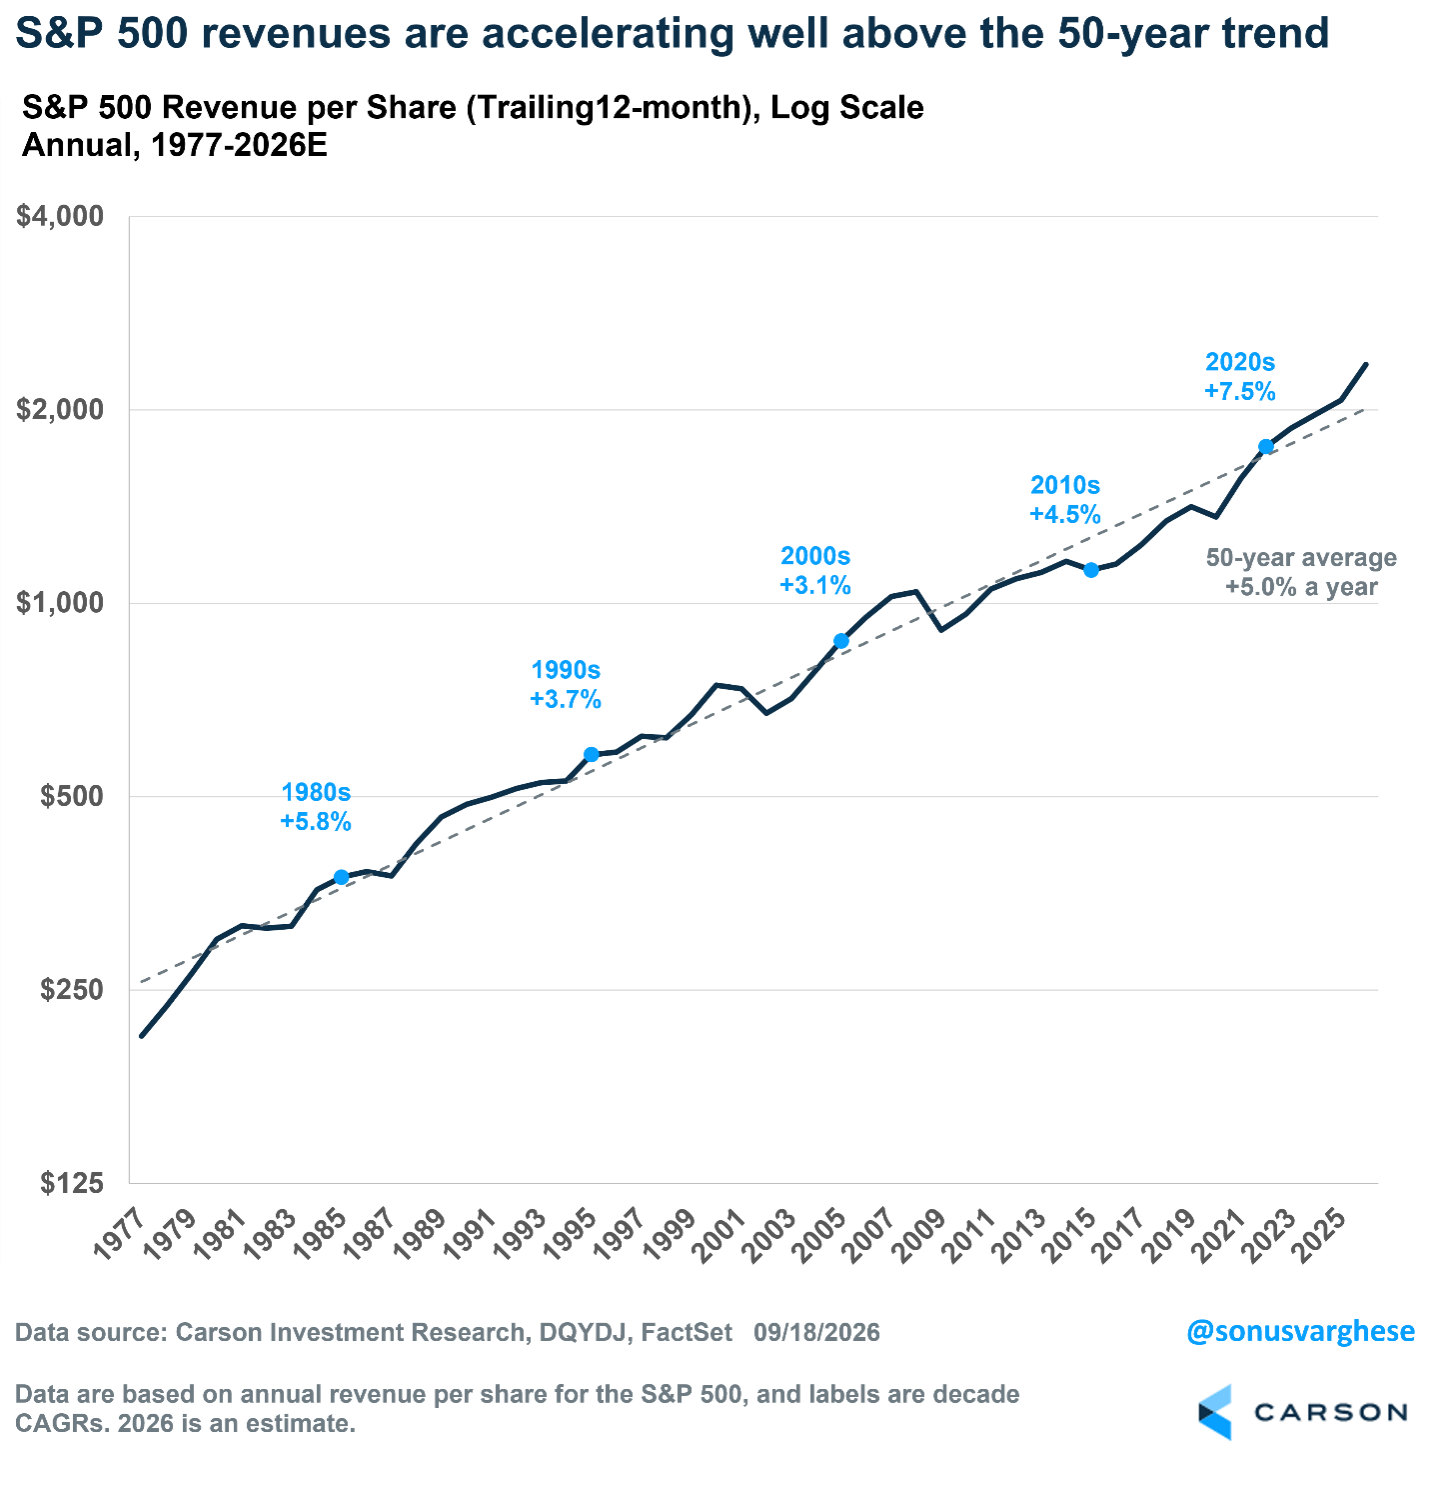
Another way to look at this is through S&P 500 revenue growth. Revenue growth isn’t exactly analogous to nominal GDP growth, because the latter measures “value add” (revenue minus intermediate inputs). But it’s still a useful coincident indicator of nominal GDP growth in this AI-capex-heavy cycle, much more so than in a consumption- or services-driven cycle (especially for the trend rather than the level, since revenues likely show bigger swings):
- From 1976–2026, S&P 500 revenues historically grew at a trend of about 5% per year.
- Revenue growth in the 2020s has averaged about 7.5% and has accelerated recently, with Q2 2026 clocking in at 15% year-over-year and Q3 expected to come in at 12%.
It would be one thing if AI were driving revenue and GDP growth by boosting productivity as it’s increasingly deployed across the economy. But right now, that’s not the case, and the boost is coming from investment spending, which is also inflationary. The big bump in revenue growth is driven primarily by technology, where revenue is expected to grow 40% in Q3. That, in turn, is driven by semiconductors (+80%), technology hardware and storage (+36%), communication equipment (+25%), and electronic equipment and components (+22%). Surging revenues for companies making key inputs for the AI buildout are the other side of a hot economy, with hot inflation.
For now, the Fed doesn’t want to spoil the party. But the longer it remains dovish, the greater the risk it may have to make a bigger adjustment later, and that may be really painful.
S&P 500 — A capitalization-weighted index of 500 stocks designed to measure performance of the broad domestic economy through changes in the aggregate market value of 500 stocks representing all major industries.
The NASDAQ 100 Index is a stock index of the 100 largest companies by market capitalization traded on NASDAQ Stock Market. The NASDAQ 100 Index includes publicly traded companies from most sectors in the global economy, the major exception being financial services.
The views stated in this letter are not necessarily the opinion of Cetera Wealth Services LLC and should not be construed directly or indirectly as an offer to buy or sell any securities mentioned herein. Investors cannot invest directly in indexes. The performance of any index is not indicative of the performance of any investment and does not take into account the effects of inflation and the fees and expenses associated with investing.
A diversified portfolio does not assure a profit or protect against loss in a declining market.
All investing involves risk, including the possible loss of principal. There is no assurance that any investment strategy will be successful. This information is from sources believed to be reliable, but Cetera Wealth Services, LLC cannot guarantee or represent that it is accurate or complete.
9136453.1-0926-C
